")


April
Saturday
Population by Year
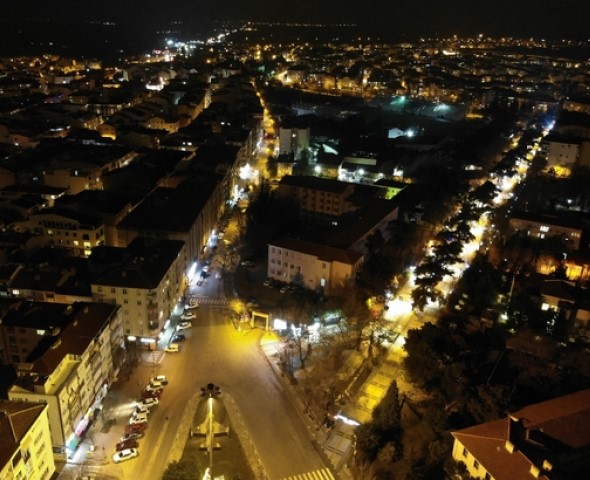
Province: Kirklareli
/ District: Luleburgaz
| Population of Luleburgaz by Years | ||
|---|---|---|
| Year | Population | Change |
| 1927 | 21.513 | |
| 1935 | 36.655 | % 41.31 |
| 1940 | 43.542 | % 15.82 |
| 1945 | 41.607 | % -4.65 |
| 1950 | 45.360 | % 8.27 |
| 1955 | 51.850 | % 12.52 |
| 1960 | 60.095 | % 13.72 |
| 1965 | 63.598 | % 5.51 |
| 1970 | 64.378 | % 1.21 |
| 1975 | 68.370 | % 5.84 |
| 1980 | 74.129 | % 7.77 |
| 1985 | 82.053 | % 9.66 |
| 1990 | 93.060 | % 11.83 |
| 1997 | 108.467 | % 14.20 |
| 2000 | 117.606 | % 7.77 |
| 2007 | 130.375 | % 9.79 |
| 2008 | 132.912 | % 1.91 |
| 2009 | 131.438 | % -1.12 |
| 2010 | 134.073 | % 1.97 |
| 2011 | 136.783 | % 1.98 |
| 2012 | 137.872 | % 0.79 |
| 2013 | 138.827 | % 0.69 |
| 2014 | 140.236 | % 1.00 |
| 2015 | 142.840 | % 1.82 |
| 2016 | 145.263 | % 1.67 |
| 2017 | 147.325 | % 1.40 |
| 2018 | 148.037 | % 0.48 |
| 2019 | 149.184 | % 0.77 |
| 2020 | 152.192 | % 1.98 |
| 2021 | 153.027 | % 0.55 |
| 2022 | 153.903 | % 0.57 |
| 2023 | 155.670 | % 1.14 |
| 2024 | 156.648 | % 0.62 |
1927 is the first census of the Republican era. The information between 1965 - 2000 comes from general censuses, and from 2007 onwards from the Address-Based Population Registration System.
Sources of Published Data: Turkey Statistical Institute
Does not replace official information. Our site is not responsible for possible typing errors.
Does not replace official information. Our site is not responsible for possible typing errors.
Publishing: 6 January 2025
- Update: 15 September 2025
- View: 4984976


Akcakoy -
Alacaoglu -
Ayvali -
Celaliye -
Ceylankoy -
Cengelli -
Cesmekolu -
Ciftlikkoy -
Davutlu -
Duguncubasi -
Emirali -
Ertugrul -
Eskibedir -
Eskitasli -
Hamitabat -
Hamzabey -
Karaagac -
Karamusul -
Kayabeyli -
Kirikoy -
Musellim -
Okali -
Ovacik -
Sakizkoy -
Saricaali -
Seyitler -
Tatarkoy -
Turgutbey -
Umurca -
Yenibedir -
Yenitasli