")


April
Sunday
Population by Year
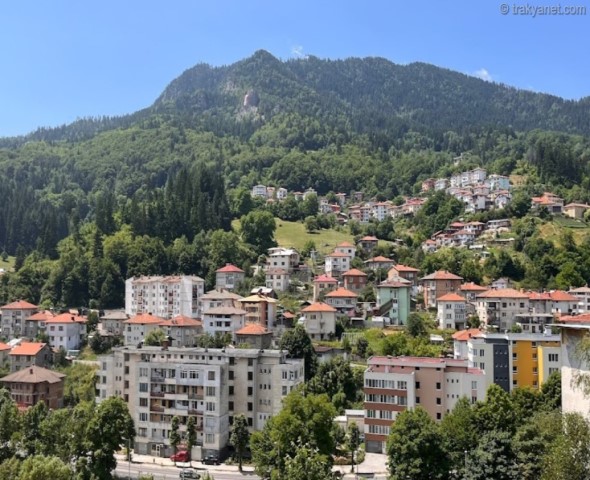
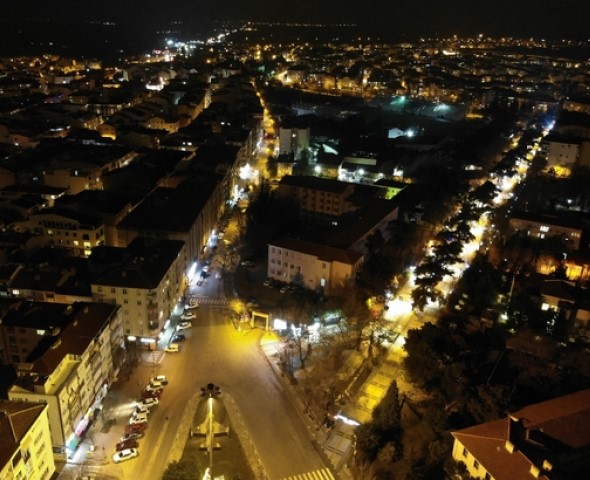
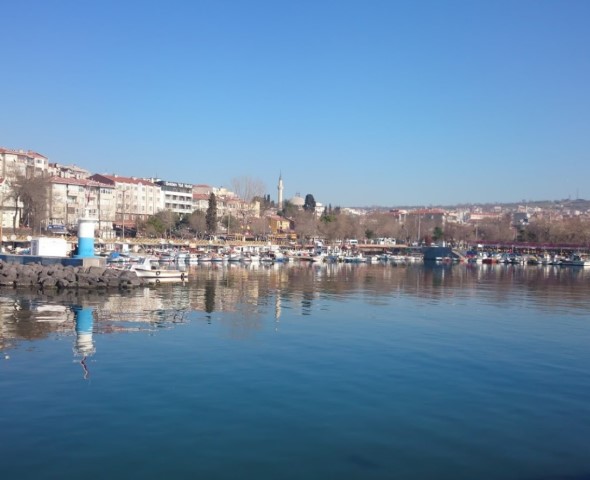
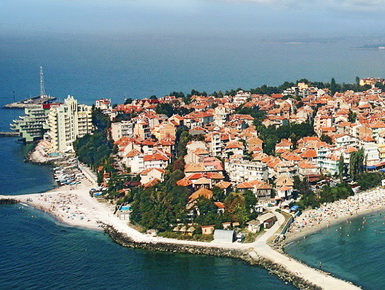
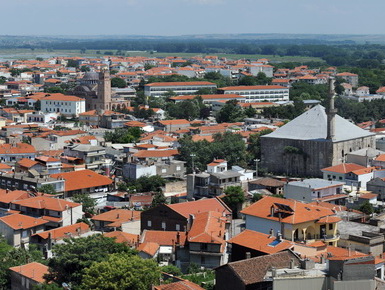
Province: Edirne
/ District: Uzunkopru
Ascioglu Center Neighborhood
Ataturk Center Neighborhood
Buyuk Sehsuvarbey Center Neighborhood
Copkoy Center Neighborhood
Cumhuriyet Center Neighborhood
Demirtas Center Neighborhood
Habib Hoca Center Neighborhood
Halise Hatun Center Neighborhood
Poplar Center Neighborhood
Kucuk Sehsuvarbey Center Neighborhood
Marshal Fevzi Cakmak Center Neighborhood
Mosque Center Neighborhood
Muradiye Mosque Center Neighborhood
Muradiye Center Neighborhood
Rizaefendi Center Neighborhood
1927 is the first census of the Republican era. The information between 1965 - 2000 comes from general censuses, and from 2007 onwards from the Address-Based Population Registration System.
Sources of Published Data: Turkey Statistical Institute
Does not replace official information. Our site is not responsible for possible typing errors.
Does not replace official information. Our site is not responsible for possible typing errors.
Publishing: 6 January 2025
- Update: 15 September 2025
- View: 4487627
More Content for the City


Alıc -
Altinyazi -
Aslihan -
Balaban -
Balabankoru -
Basagil -
Bayramli -
Beykonak -
Bildir -
Cakmak -
Cali -
Cavuslu -
Ciftlik -
Cobanpinar -
Danisment -
Degirmenci -
Derekoey -
Elmali -
Eskikoy -
Gazimehmet -
Gemici -
Hamidiye -
Hamitli -
Harmanli -
Hasanpinar -
Kadiagili -
Kadikoy -
Karaburcek -
Karapinar -
Karayayla -
Kavacik -
Kavakazma -
Kirkkavak -
Kirkoy -
Kiremitcisalih -
Kurdu -
Kurtbey -
Kurttepe -
Maksutlu -
Malkoc -
Meseli -
Muhacirkadi -
Omerbey -
Saclimusellim -
Salarli -
Sazlimalkoc -
Sigircilik -
Sipahi -
Sultansah -
Suleymaniye -
Turnaci -
Turkobasi -
Yagmurca