")


April
Monday
Population by Year
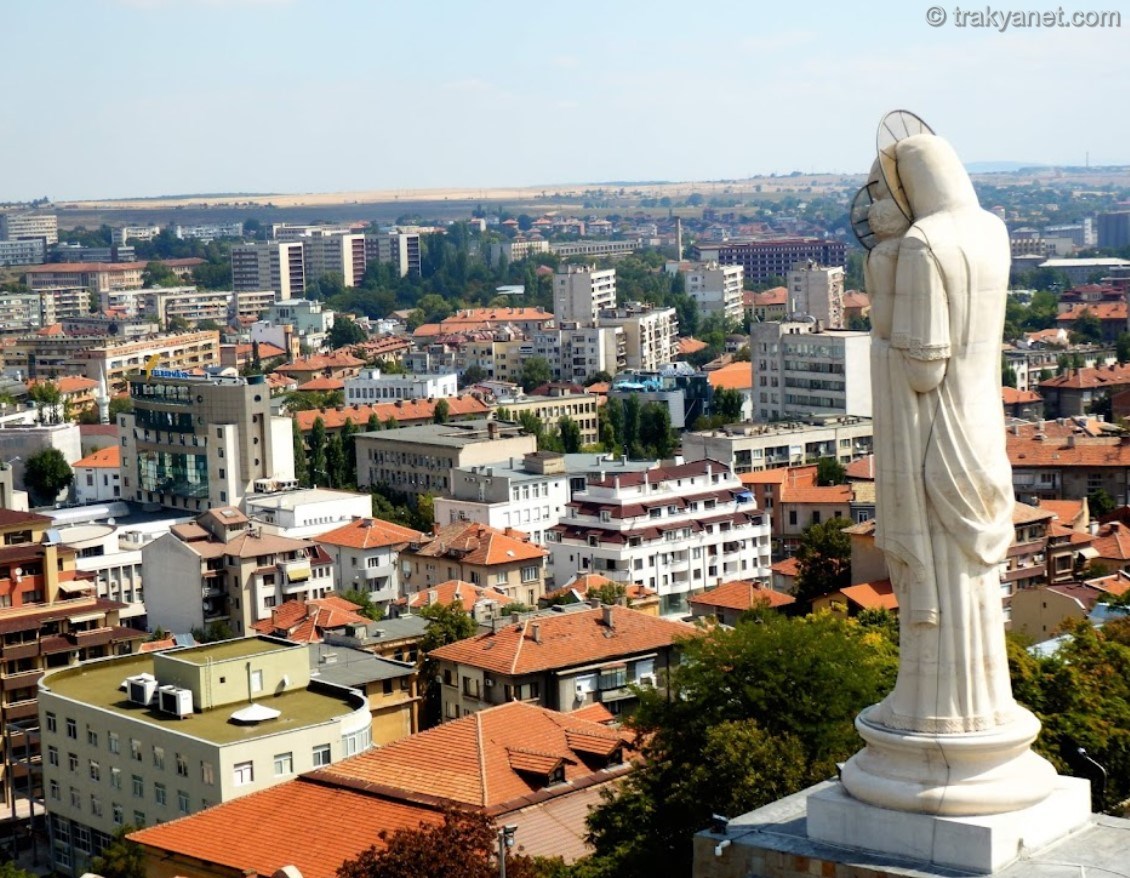
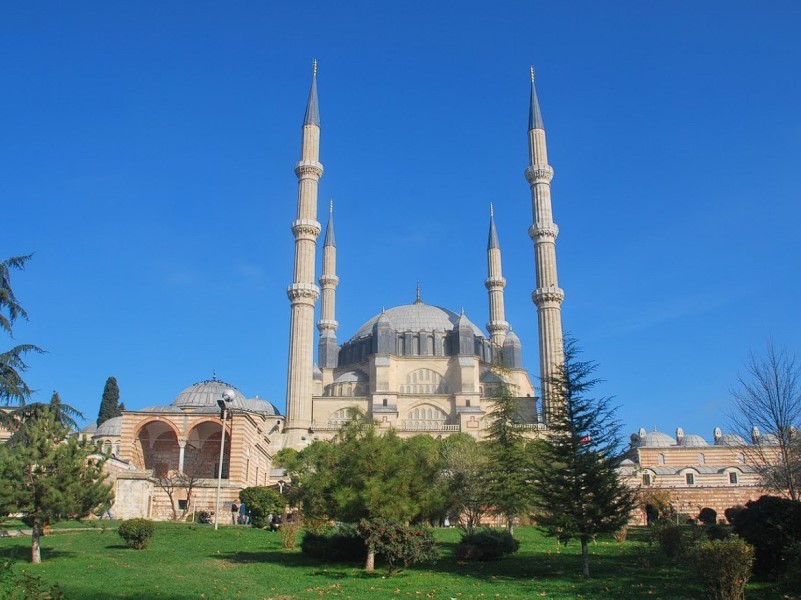
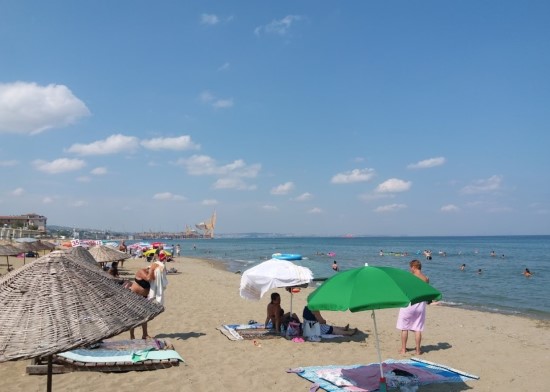
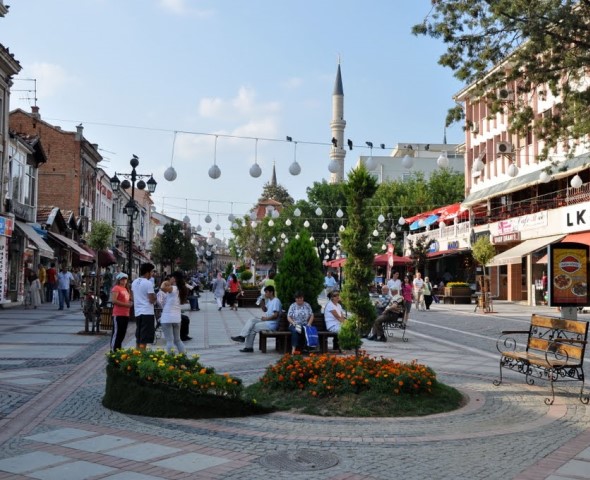
Province: Edirne
/ District: Edirne Center
100th Year Center Neighborhood
1nci Murat Center Neighborhood
Abdurrahman Center Neighborhood
Ataturk Center Neighborhood
Babademirtas Center Neighborhood
Barutluk Center Neighborhood
Cavusbey Center Neighborhood
Cumhuriyet Center Neighborhood
Dilaverbey Center Neighborhood
Fatih Center Neighborhood
Istasyon Center Neighborhood
Karaagac Center Neighborhood
Koca Sinan Center Neighborhood
Kurtulus Center Neighborhood
Medrese Ali Bey Center Neighborhood
Menzilahir Center Neighborhood
Meydan Center Neighborhood
Mithat Pasa Center Neighborhood
Nisancipasa Center Neighborhood
Sabuni Center Neighborhood
Saricapasa Center Neighborhood
Sukrupasa Center Neighborhood
Talatpasa Center Neighborhood
Umurbey Center Neighborhood
Yancikci Sahin Center Neighborhood
Yeniimaret Center Neighborhood
Yildirim Beyazit Center Neighborhood
Yildirim Haci Sarraf Center Neighborhood
1927 is the first census of the Republican era. The information between 1965 - 2000 comes from general censuses, and from 2007 onwards from the Address-Based Population Registration System.
Sources of Published Data: Turkey Statistical Institute
Does not replace official information. Our site is not responsible for possible typing errors.
Does not replace official information. Our site is not responsible for possible typing errors.
Publishing: 6 January 2025
- Update: 15 September 2025
- View: 4505026
More Content for the City


Ahi -
Avariz -
Bosna -
Budakdoganca -
Buyukdolluk -
Buyukismailce -
Degirmenyeni -
Demirhanli -
Doyran -
Ekmekci -
Elcili -
Eskikadin -
Haciumur -
Hasanaga -
Hatip -
Hidiraga -
Iskender -
Karabulut -
Karakasim -
Karayusuf -
Kayapa -
Kemal -
Korucu -
Koseniftligi -
Kucukdolluk -
Meneksesofular -
Muratalci -
Musabeyli -
Orhaniye -
Sarayakpinar -
Sazlidere -
Suakacagi -
Tayakadin -
Uzgac -
Uyaklitatar -
Yenikadin -
Yolustu